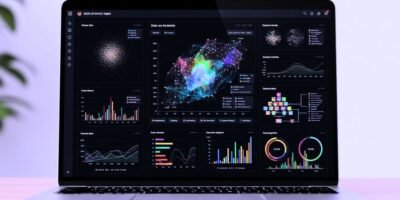
In the era of big data, organizations face the challenge of extracting valuable insights from vast and complex datasets. Big data visualization software has emerged as a game-changer, enabling organizations to understand and communicate data in a meaningful and actionable way. These software solutions combine powerful analytics capabilities with intuitive visualizations to help users effectively explore, analyze, and present large-scale data sets. This article explores the concept of big data visualization software, its benefits, and its transformative impact on data-driven decision-making.
Understanding Big Data Visualization Software
Big data visualization software refers to the tools and technologies enabling organizations to represent and interact with large, complex datasets visually. These software solutions leverage advanced algorithms and visual representations, such as charts, graphs, heatmaps, and interactive dashboards, to uncover patterns, trends, and insights within the data. They allow users to explore data, drill down into specific details, and gain a holistic understanding of complex information quickly.
Data Exploration and Analysis
Big data visualization software empowers users to explore and analyze large datasets effectively. The visual representations enable users to identify patterns, correlations, and outliers that may be difficult to discern in raw data. By interactively drilling down, filtering, and manipulating the visualizations, users can confidently uncover hidden insights and make data-driven decisions. These software solutions provide a user-friendly interface that simplifies complex data analysis, enabling users with varying technical expertise to derive meaningful insights.
Enhanced Decision-Making
Big data visualization software enables organizations to make data-driven decisions quickly and confidently. By transforming complex data into visual representations, decision-makers can understand the data intuitively and identify trends or anomalies at a glance. Interactive dashboards and real-time visualizations enable stakeholders to monitor key performance indicators (KPIs) in real time, allowing for timely interventions and course corrections. The ability to explore data from multiple perspectives and uncover actionable insights empowers organizations to make informed decisions that drive business growth and operational efficiency.
Communication and Collaboration
Big data visualization software facilitates effective communication and collaboration among teams and stakeholders. Visualizations make complex information accessible and easily understandable to a wider audience. Instead of relying on spreadsheets or lengthy reports, visualizations enable users to convey insights, trends, and recommendations compellingly and concisely. With the ability to share interactive dashboards and visualizations, teams can collaborate in real time, align on goals, and drive data-driven decision-making collectively.
Real-Time Monitoring and Alerts
Big data visualization software enables real-time monitoring of critical metrics and key performance indicators. Organizations can set up alerts and notifications based on specific thresholds or conditions, allowing them to take immediate action when deviations occur. Real-time visualizations provide instant visibility into operational processes, enabling organizations to promptly identify and respond to emerging opportunities or issues. This capability is precious in finance, supply chain management, and cybersecurity sectors, where timely insights and proactive decision-making are crucial.
Scalability and Flexibility
Big data visualization software offers scalability and flexibility to handle large and diverse datasets. These solutions can process and visualize data from various sources, including structured and unstructured data, in real-time or batch processing. As organizations deal with ever-increasing data volumes, big data visualization software can scale horizontally to accommodate expanding data requirements. Moreover, these solutions can be integrated with existing data infrastructure, allowing organizations to leverage their investments while unlocking the power of advanced visual analytics.
Predictive and Prescriptive Analytics
Big data visualization software can integrate with advanced analytics techniques, such as predictive and prescriptive analytics. By combining visualization capabilities with machine learning algorithms, organizations can uncover patterns, forecast future trends, and simulate scenarios to support decision-making. These solutions enable users to interactively explore predictive models, perform “what-if” analyses, and optimize outcomes based on different variables. Predictive and prescriptive analytics empower organizations to proactively identify opportunities, mitigate risks, and optimize business processes.
Conclusion
Big data visualization software empowers organizations to unlock the potential of their vast and complex datasets. These software solutions facilitate data exploration, enhance decision-making, and foster effective communication and collaboration by transforming data into intuitive visual representations. Analyzing and presenting big data visually allows organizations to derive actionable insights, respond to real-time market dynamics, and gain a competitive advantage. As organizations continue to navigate the era of big data, embracing big data visualization software is essential for maximizing the value of data and leveraging it as a strategic asset.

