Effective data visualization and presentation are critical in conveying complex information and insights. This article will explore think-cell’s features, benefits, and impact, highlighting how it elevates data-driven communication and empowers users to present their ideas confidently and clearly.
What is think-cell?
think-cell is an innovative software suite that enhances data visualization, chart creation, and presentation design for professionals across various industries. Designed to integrate with Microsoft PowerPoint seamlessly, the platform offers a range of features and tools that simplify the creation of complex charts, graphs, and data-driven presentations. From business analysts and consultants to educators and researchers, think-cell caters to a diverse audience, making it an indispensable tool for transforming data into impactful visual stories.
think-cell, a powerful data visualization and presentation software, has emerged as a leading solution that transforms raw data into compelling visualizations and charts. The solution empowers professionals to create stunning presentations and streamline their data visualization workflow with its user-friendly interface, seamless integration with Microsoft PowerPoint, and advanced automation capabilities.
Recommendations and Ratings
EXPERT RECOMMENDATIONS
Overall
-
Easy-of-Use - 80
-
Feature and Functionality - 85
-
Customer Support - 85
-
Setup and Integration - 80
-
Value of Money - 85

User Review
( vote)Key Features and Capabilities of think-cell
think-cell offers a rich set of features and capabilities, making it a versatile and powerful tool for data visualization and presentation design. Let’s delve into some key components of this transformative software:
Chart Creation and Customization
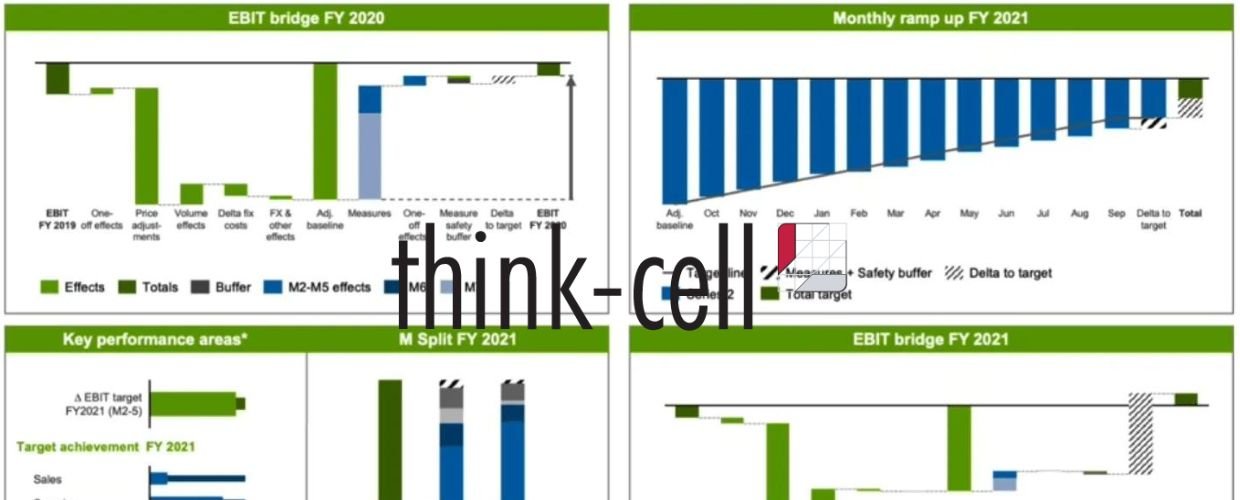
One of the standout features of think-cell is its ability to streamline chart creation. Users can generate a wide range of charts with a few clicks, including column charts, bar charts, line charts, waterfall charts, and more. The software’s intuitive interface allows easy customization, allowing users to tailor charts to their needs and branding guidelines.
Data Linking and Automation
Its data-linking functionality facilitates real-time data updates in charts and graphs. Users can link charts directly to Excel or other data sources, ensuring that changes in the underlying data automatically reflect in the presentation. This automation reduces manual effort and the risk of errors, ensuring that presentations remain up-to-date.
Layout and Slide Creation
think-cell simplifies the creation of cohesive and visually appealing presentation slides. Users can design templates and set up consistent layouts across slides, ensuring a professional and polished look for their presentations. The software’s Slide Master feature allows easy control over the visual elements, enabling users to maintain consistent branding and design aesthetics.
Mathematical Equation Editor
The platform offers a mathematical equation editor for professionals working in scientific or technical fields. This feature allows users to create complex mathematical equations and formulas directly within PowerPoint, making it a valuable asset for educators, researchers, and engineers.
Gantt Chart Creation
Its Gantt chart tool enables users to create dynamic and interactive project timelines. Users can efficiently plan and manage projects, set dependencies, allocate resources, and easily track progress. The Gantt chart feature helps businesses to streamline project management and enhances communication of project status to stakeholders.
Integration with PowerPoint
The platform seamlessly integrates with Microsoft PowerPoint, allowing users to leverage the familiar PowerPoint interface while accessing think-cell’s powerful data visualization capabilities. This integration ensures a smooth and efficient workflow, as users can easily incorporate think-cell charts and graphs into their presentations.
Benefits and impact of think-cell
Adopting think-cell brings numerous transformative benefits for professionals seeking to elevate their data visualization and presentation skills. Let’s explore some key impacts of using the visualization solution.
Enhanced Data Communication
The platform enables professionals to convey complex information clearly and engagingly. By transforming data into visual representations, users can effectively communicate insights, trends, and key takeaways to their audience, making presentations more compelling and memorable.
Streamlined Data Visualization Workflow
Think-cell streamlines the data visualization process with intuitive chart creation and automation capabilities. Users can generate charts and graphs effortlessly, link them to data sources for real-time updates, and customize visuals to match their unique requirements. This efficiency saves time and effort, allowing users to focus on content and storytelling.
Consistent and Professional Presentations
Its template-driven approach ensures that presentations have a consistent and professional look. Users can maintain branding guidelines, create cohesive slide layouts, and apply uniform design elements throughout the presentation, reinforcing the credibility and impact of their messages.
Real-Time Data Updates
By linking charts and graphs to data sources, think-cell enables real-time data updates without manual intervention. It ensures that presentations always reflect the latest information, even when data changes frequently, fostering data accuracy and ensuring its relevance.
Improved Project Management and Planning
The visualization software solution Gantt chart tool enhances project management by providing an easy-to-use interface for creating dynamic project timelines. Users can efficiently plan, track, and manage projects, making it a valuable asset for project managers, teams, and stakeholders.
Time-Saving and Efficiency
think-cell’s automation features significantly reduce the time spent on manual chart creation and data updates. Users can focus on refining content, refining storytelling, and practicing their delivery, resulting in more efficient and impactful presentations.
Conclusion
think-cell is a powerful and versatile data visualization and presentation software empowering professionals to create compelling and data-driven presentations easily. With its user-friendly interface, real-time data updates, and seamless integration with Microsoft PowerPoint, the platform enhances data communication and elevates the presentation experience. From streamlining chart creation to improving project management, the visualization solution drives efficiency, collaboration, and excellence in data-driven communication. By embracing think-cell, professionals can unlock the full potential of their data, elevate their presentations, and confidently share their ideas with stakeholders and audiences alike.