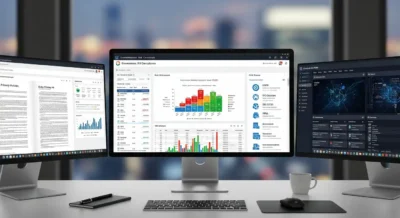
In today’s data-rich landscape, the value of information must be recognized. Data analytics and visualization have emerged as pivotal tools in unraveling meaningful insights from vast and intricate datasets. These insights, in turn, equip businesses with the capability to make informed decisions and gain a competitive edge. By synergizing data analytics with visualization, organizations can unearth concealed patterns, identify trends, and uncover correlations within their data. This comprehensive exploration delves into the profound significance of data analytics and visualization elucidates their essential components, and illuminates the transformative influence they wield over contemporary businesses.
The Significance of Data Analytics and Visualization
The rapidly evolving business environment has ushered data analytics and visualization into the forefront of strategic initiatives. The following points underscore their profound significance.
- Data-Driven Decision-Making: as the cornerstone of evidence-based decision-making, data analytics empowers organizations to ground their choices in objective data and insights. This shift from intuitive decision-making to data-driven strategies ensures accuracy and efficiency in the decision-making process.
- Identifying Trends and Patterns: The sheer volume and complexity of modern data are often overwhelming, but data analytics rises to the occasion by unraveling hidden trends, patterns, and relationships. What was once invisible to the human eye can now be meticulously extracted and analyzed, ushering in a new era of proactive decision-making.
- Predictive Analysis: Data analytics transcends the boundaries of time by utilizing historical data to forecast future trends. Doing so equips businesses with the capability to embark on proactive measures and formulate comprehensive strategic plans, mitigating the element of surprise and harnessing future opportunities.
- Improved Efficiency and Productivity: Inefficiencies are the silent adversaries of productivity. Data analytics functions as a beacon, illuminating these inefficiencies and streamlining processes to usher in a new era of enhanced productivity and substantial cost savings.
- Visual Representation of Data: The intricate web of data can overwhelm stakeholders, especially those needing a technical background. Data visualization transcends these barriers by transforming complex data into easily understandable and interactive graphical formats, rendering data interpretation an accessible endeavor.
Key Components of Data Analytics and Visualization
Understanding the critical components of data analytics and visualization is crucial for businesses looking to make informed decisions based on data. By breaking down complex data into easily digestible visualizations, organizations can gain valuable insights into customer behavior, market trends, and more.
- Data Collection and Preparation: The journey of data analytics commences with the meticulous collection of data from diverse sources, spanning databases, sensors, websites, and social media platforms. The collected data undergoes a rigorous cleaning, organization, and preparation process to ensure its suitability for analysis.
- Descriptive Analytics: Descriptive analytics, the retrospective gaze into the annals of data, unveils the historical performance of an organization. By deciphering past trends and patterns, businesses glean valuable insights into their trajectory, facilitating informed decision-making.
- Diagnostic Analytics: Diagnostic analytics operates as a detective, unraveling the enigmatic threads that have woven the tapestry of past outcomes. Organizations glean a deeper understanding of causality by dissecting the factors contributing to successes or failures, enabling them to optimize strategies.
- Predictive Analytics: The crystal ball of data analytics, predictive analytics, employs historical data as its oracle. Through the creation of predictive models, this facet of analytics enables organizations to peer into the future, anticipate upcoming trends, and embrace proactive measures.
- Prescriptive Analytics: Prescriptive analytics ascends the hierarchy by forecasting outcomes and prescribing optimal courses of action. By synthesizing data and models, this facet guides decision-making and propels organizations toward products that are not merely advantageous but optimized.
- Data Visualization Tools: Data visualization tools emerge as artistic mediums, transforming raw data into compelling visual narratives. Through the creation of charts, graphs, and interactive dashboards, these tools empower stakeholders to comprehend intricate data patterns at a glance.
- Machine Learning and Artificial Intelligence: The rapid advancement of machine learning and artificial intelligence augments the arsenal of data analytics. These technologies automate complex processes, unearth latent patterns, and foster an era of data-driven decision-making that transcends human capabilities.
Transformative Impact of Data Analytics and Visualization
The transformative impact of data analytics and visualization cannot be overstated. By leveraging these tools, businesses can unlock valuable insights that drive growth, improve customer experiences, and increase competitive advantage.
- Business Intelligence and Insights: The symbiotic relationship between data analytics and visualization empowers businesses with a treasure trove of insights. These insights, gleaned from the depths of data, illuminate the path to strategic decision-making, thereby bestowing a potent competitive advantage upon organizations.
- Improved Customer Experience: Understanding customer behavior and preferences has become an art form, and data analytics provides the canvas. By delving into customer data, businesses can sculpt personalized experiences that resonate with their clientele, fostering loyalty and advocacy.
- Operational Efficiency: The discerning eye of data analytics detects inefficiencies within operational processes. With this knowledge, organizations optimize processes, eliminating bottlenecks and ushering in streamlined operations and substantial cost savings.
- Risk Management: Risk, an omnipresent specter in the business realm, bows before data analytics prowess. Businesses can proactively manage potential pitfalls by identifying and quantifying risks, bolstering their resilience, and ensuring regulatory compliance.
- Innovation and Product Development: Data analytics is an avant-garde compass, guiding businesses toward emerging trends and developing market demands. Armed with this foresight, organizations sculpt innovative products and services that capture the zeitgeist of evolving consumer preferences.
Conclusion
In an era characterized by data ubiquity, the symbiosis of data analytics and visualization reigns supreme as the catalyst for transformative change. These twin pillars transmute raw data into a mosaic of actionable insights, fueling strategic agility and equipping businesses to weather the storm of competition and seize the mantle of leadership.
As data-driven paradigms become the norm, the resonance of data analytics and visualization will crescendo, sculpting the contours of informed decision-making and steering the course of business prosperity. Organizations that embrace these dynamic tools as integral components of their modus operandi stand poised to conquer the challenges and seize the opportunities strewn across the ever-evolving landscape.


