In today’s data-driven world, organizations across industries are inundated with vast data. In this article, we will explore the capabilities of JMP and how it empowers users to uncover valuable insights through data analysis and statistical discovery.
What is JMP?
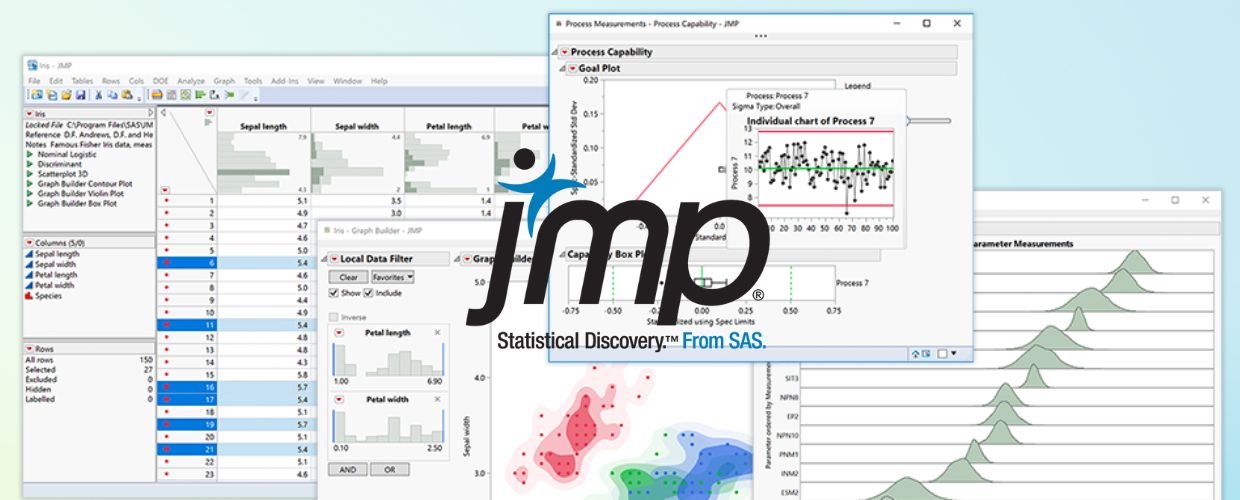
JMP is a robust and interactive data analysis software that combines powerful statistical tools, dynamic visualizations, and exploratory data analysis techniques. It offers an intuitive and user-friendly interface, making it accessible to novice and experienced data analysts. Developed by SAS, a leader in analytics and business intelligence, the platform provides a wide range of statistical and graphical tools to uncover patterns, relationships, and trends in data, enabling users to gain actionable insights quickly.
In the data-driven world, businesses need powerful tools to effectively analyze and visualize data to extract meaningful insights and make informed decisions. JMP, a comprehensive statistical discovery software developed by SAS, is a trusted solution widely used by researchers, data analysts, and scientists. With its user-friendly interface and robust features, JMP provides businesses with the necessary tools to make data-driven decisions that can drive growth and success.
Recommendations and Ratings
EXPERT RECOMMENDATIONS
Overall
-
Easy-of-Use - 80
-
Feature and Functionality - 85
-
Customer Support - 85
-
Setup and Integration - 90
-
Value of Money - 85

User Review
( votes)Key Features and Capabilities of JMP
JMP provides rich features and capabilities that simplify data analysis and enhance statistical discovery. Let’s delve into some of the key components of this powerful software.
Exploratory Data Analysis (EDA)
JMP offers a comprehensive suite of tools for exploratory data analysis. Users can visualize data using dynamic and interactive graphics, histograms, box plots, and scatter plots. With drag-and-drop functionality, users can easily manipulate variables, apply filters, and explore data from multiple angles. Its EDA capabilities facilitate the identification of outliers, patterns, and anomalies, enabling users to gain a deeper understanding of their data.
Statistical Modeling and Analysis
The platform provides a wide array of statistical modeling and analysis tools. Users can perform regression analysis, analysis of variance (ANOVA), generalized linear models (GLMs), mixed models, and more. The software offers a user-friendly interface to specify model inputs, examine statistical outputs, and interpret results. With interactive visualizations and built-in statistical diagnostics, users can evaluate the validity and reliability of their models, ensuring accurate and robust analysis.
Design of Experiments (DOE)
JMP simplifies designing experiments and optimizing processes with its DOE capabilities. Users can create and analyze experimental designs like factorial, response surface, and mixture designs. The software guides users through the DOE process, helping them identify critical factors, understand interactions, and optimize outcomes. Its intuitive interface and visualizations allow users to interpret results and make data-driven decisions to improve processes and products.
Quality and Reliability Analysis
For organizations focused on quality control and reliability, JMP provides specialized tools to analyze product performance, reliability data, and failure rates. Users can perform reliability analyses, create control charts, conduct capability analyses, and visualize process variations. It’s quality and reliability analysis features enable users to identify areas for improvement, reduce defects, and enhance overall product quality.
Predictive Modeling and Machine Learning
JMP incorporates predictive modeling and machine learning techniques to uncover patterns and make accurate predictions. Users can build predictive models using techniques such as decision trees, neural networks, and support vector machines. The software facilitates model building, validation, and interpretation, allowing users to make data-driven predictions and forecasts.
Interactive Dashboards and Reports
The platform enables users to create interactive dashboards and reports to present and share data insights effectively. Users can customize visualizations, combine multiple charts, and create interactive elements to provide a comprehensive view of their analysis. These dashboards and reports can be shared with colleagues or stakeholders, fostering collaboration and enabling data-driven decision-making.
Benefits of JMP
JMP offers several benefits that empower users to gain valuable insights and make data-driven decisions. Let’s explore some key advantages.
Streamlined Data Analysis
JMP’s intuitive interface and user-friendly tools streamline the data analysis process, allowing users to perform complex analyses easily. Users can quickly import, clean, explore, and analyze data, saving time and effort in the data preparation stage.
Visual and Interactive Data Exploration
Its dynamic and interactive visualizations enable users to explore data from multiple perspectives, uncover hidden patterns, and better understand complex datasets. Interactive features allow users to drill down into specific data points, enabling them to make more accurate observations and discoveries.
Statistical Rigor and Validity
JMP provides a comprehensive set of statistical tools and techniques, ensuring the rigor and validity of data analysis. Users can apply statistical models, conduct hypothesis tests, and interpret results using built-in statistical diagnostics. It provides that data-driven decisions are based on robust analysis and statistical evidence.
Collaboration and Knowledge Sharing
Its dashboards and reports facilitate collaboration and knowledge sharing within teams and departments. Users can share their analyses, visualizations, and reports with colleagues or stakeholders, enabling effective communication of insights and fostering a data-driven culture throughout the organization.
Empowering Non-Statisticians
JMP’s user-friendly interface and intuitive tools make it accessible to users with varying statistical expertise. Non-statisticians can leverage the power of advanced statistical techniques without requiring extensive training, enabling a broader range of users to conduct data analysis effectively.
Seamless Integration with SAS
The platform seamlessly integrates with other SAS products and the SAS ecosystem. This integration enables users to leverage the power of SAS analytics and combine JMP analyses with SAS workflows, expanding the range of advanced analytics capabilities available.
Conclusion
JMP has emerged as a powerful data analysis and statistical discovery tool, empowering users to uncover valuable insights and make data-driven decisions. With its intuitive interface, comprehensive statistical tools, interactive visualizations, and seamless integration, the platform simplifies the process of data exploration, modeling, and analysis. From exploratory data analysis to statistical modeling, quality analysis, and predictive analytics, the solution offers a wide range of capabilities that cater to diverse data analysis needs. By embracing JMP, organizations can unlock the full potential of their data, drive innovation, and achieve a competitive edge in today’s data-driven world.