In today’s data-driven world, the ability to effectively present information in a visually appealing and easy-to-understand manner is crucial, where Google Chart Tools come into play. In this article, we will explore the various features and capabilities of Google Chart Tools and how they can revolutionize how you present your data.
What are Google Chart Tools?
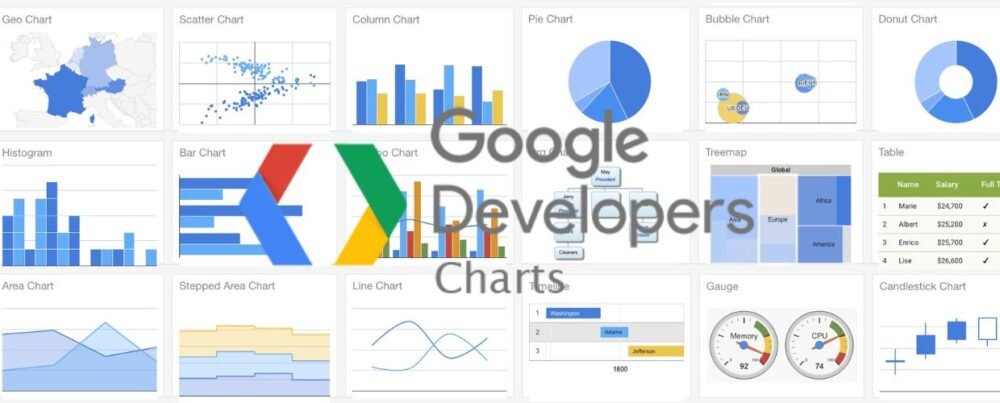
Google Chart Tools is a powerful set of data visualization tools provided by Google, enabling users to create stunning charts, graphs, and maps for their websites and applications. It is a collection of charting libraries and tools that allow developers to incorporate interactive charts into their web pages and applications. The main components of Google Chart Tools include the Chart API, Chart Libraries, and the Image Charts API.
The Chart API is a web service that allows you to generate static or interactive charts by specifying the chart type, data, and formatting parameters in a URL. It makes it incredibly easy to embed charts in web pages dynamically. The Chart API supports various charts, including line charts, bar charts, pie charts, scatter plots, and more. Additionally, it provides extensive customization options for colors, labels, legends, and tooltips.
Google Chart Libraries are JavaScript-based tools that enable developers to create dynamic and interactive charts directly within their web applications. Unlike the Chart API, the Chart Libraries offer more flexibility and interactivity, allowing for real-time updates, user interactions, and animations. The libraries are loaded from Google’s servers and can be easily integrated into your application by adding a few lines of code.
Recommendations and Ratings
EXPERT RECOMMENDATIONS
Overall
-
Easy-of-Use - 85
-
Feature and Functionality - 90
-
Customer Support - 85
-
Setup and Integration - 80
-
Value of Money - 85

User Review
( votes)Features and Capabilities
Google Chart Tools offer many features and capabilities to enhance your data visualization. Some of its features and capability are discussed below.
Data Integration
Google Chart Tools seamlessly integrate with various data sources, including Google Sheets, CSV files, and databases. It allows you to pull data directly from these sources and generate charts in real-time.
Interactivity
With Google Chart Libraries, you can create interactive charts that respond to user interactions. For example, you can enable zooming, panning, and scrolling to allow users to explore the data more effectively.
Animations
Adding animations to your charts can make them more engaging and visually appealing. Google Chart Tools provides built-in animation options to create smooth transitions and effects, enhancing the user experience.
Geographical Visualization
If you need to visualize geographical data, Google Chart Tools offer powerful mapping capabilities. You can create custom maps, heatmaps, and geo charts to display location-based data intuitively and interactively.
Accessibility
Google prioritizes accessibility, ensuring that charts are usable by individuals with disabilities. It includes screen reader support, keyboard navigation, and high-contrast options to make charts accessible to a wider audience.
Responsive Design
With the increasing use of mobile devices, responsive design has become crucial. Google Chart Tools are designed to be responsive, automatically adjusting the size and layout of charts to fit different screen sizes and orientations.
Benefits for Business
Google Chart Tools provides a simple and intuitive way to visualize data without requiring any complex coding or extensive design skills. Some of its benefits are discussed below.
Integration with Google Services
One of the significant advantages is its seamless integration with other Google services. For example, you can easily embed Google Charts into Google Docs, Google Sheets, or Google Slides presentations. It allows you to create visually compelling reports and presentations with real-time data.
Extensibility
Google Chart Tools offer extensive customization options and can be extended with third-party libraries and frameworks. You can combine Google Chart Libraries with popular JavaScript frameworks like AngularJS or React to create more advanced and interactive visualizations.
Support and Community
Google provides comprehensive documentation and examples to help users start with Google Chart Tools. The official Google Charts website offers many resources, including tutorials, code samples, and a dedicated forum where developers can seek assistance and share their experiences.
Limitations
While Google Chart Tools offer a wide range of features, it’s worth noting a few limitations. Firstly, a cloud-based service requires an internet connection to display charts. Some advanced customization options may require more extensive coding knowledge or additional libraries.
Conclusion
Google Chart Tools is an excellent choice for developers and users looking to create visually appealing and interactive charts and graphs. With its simple integration, extensive features, and robust customization options, Google Chart Tools provides an efficient way to visualize data for various applications. Whether you must present data on a website, create dynamic dashboards, or build data-driven reports, Google Chart Tools can elevate your data visualization game to new heights.