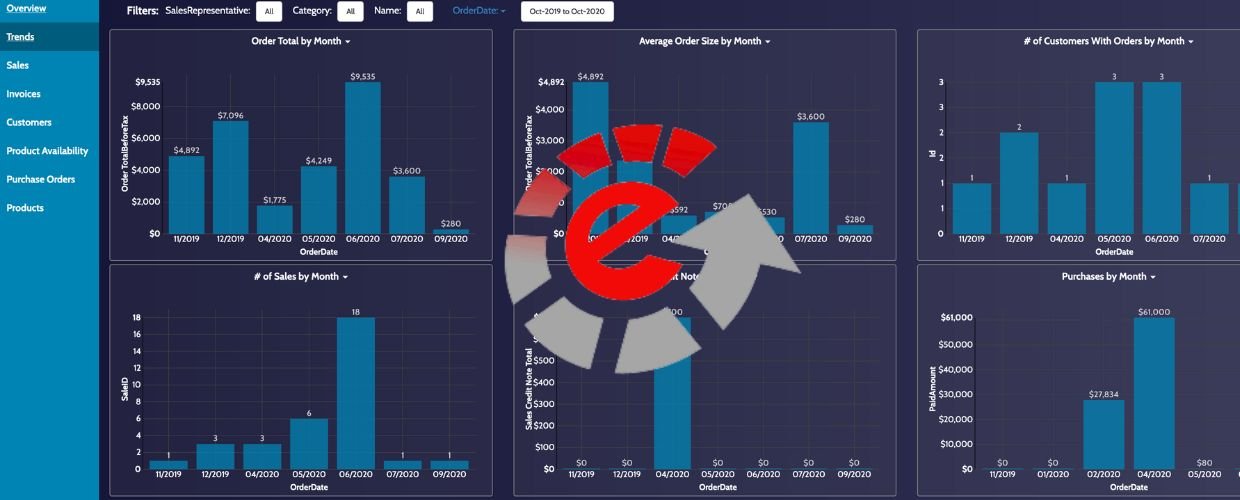
In the era of data-driven decision-making, organizations continuously seek ways to turn their vast amounts of data into valuable insights. In this article, we will explore the features, benefits, and impact of Easy Insight, highlighting how it enhances data-driven decision-making and enables organizations to uncover hidden patterns and trends within their data.
What is Easy Insight?
Easy Insight is a cloud-based business intelligence (BI) and data visualization platform to streamline data analysis and reporting. The platform allows organizations to connect, analyze, and visualize data from various sources, including databases, spreadsheets, and third-party applications. With its drag-and-drop interface and customizable dashboards, the platform empowers users to transform raw data into visually appealing and interactive visualizations, enabling them to make data-driven decisions confidently.
Easy Insight, a powerful business intelligence and data visualization solution, has emerged as a transformative solution that simplifies data analysis and reporting. With its intuitive interface, seamless data integration, and robust visualization capabilities, the intelligent software platform empowers businesses to gain deeper insights, make informed decisions, and drive growth.
Recommendations and Ratings
EXPERT RECOMMENDATIONS
Overall
-
Easy-of-Use - 80
-
Feature and Functionality - 85
-
Customer Support - 95
-
Setup and Integration - 80
-
Value of Money - 85
User Review
4.45 (22 votes)Key Features and Capabilities of Easy Insight
Easy Insight offers comprehensive features and capabilities, making it a versatile and powerful business intelligence solution. Let’s delve into some key components of this transformative platform.
Data Integration and Connectivity
One of the standout features of Easy Insight is its seamless data integration with multiple sources. Users can connect to various data repositories, including cloud-based applications, on-premises databases, and spreadsheets. The platform’s extensive data connectors ensure users can easily access and analyze data from different systems.
Drag-and-Drop Data Visualization
Its user-friendly drag-and-drop interface simplifies the process of data visualization. Users can effortlessly create interactive charts, graphs, and dashboards by dragging data elements onto the canvas and customizing visualizations to suit their needs. This intuitive interface enables users to create compelling visualizations without complex coding or data manipulation.
Customizable Dashboards
With Easy Insight, users can create personalized dashboards that consolidate key performance indicators (KPIs) and metrics in one place. These dashboards provide a comprehensive view of business performance, enabling users to monitor trends, track progress, and identify areas for improvement in real time.
Advanced Analytics and Reporting
The platform offers advanced analytics and reporting capabilities beyond basic data visualization. Users can perform complex calculations, apply filters, and group data to derive deeper insights from their data. Additionally, the platform supports ad-hoc reporting, allowing users to create custom reports on the fly.
Automated Data Refresh
Easy Insight offers automated data refresh options, ensuring that data visualizations and dashboards remain up-to-date with the most current information. Users can schedule data refreshes at regular intervals, reducing the need for manual data updates and ensuring data accuracy.
Collaborative Features
The intelligent platform facilitates collaboration among team members by enabling data sharing and report distribution. Users can share dashboards and visualizations with colleagues and stakeholders, promoting a data-driven culture and fostering collaboration across the organization.
Benefits and Impact of Easy Insight
Adopting Easy Insight brings numerous transformative benefits for organizations seeking to enhance their data-driven decision-making processes. Let’s explore some key impacts of using the solution.
Improved Data Understanding
Its interactive data visualizations enable users to understand complex datasets more intuitively. Visualizing data in charts and graphs allows users to identify patterns, trends, and outliers, leading to a deeper understanding of their data and making more informed decisions.
Streamlined Data Analysis
Easy Insight streamlines the data analysis by providing a user-friendly data visualization and exploration interface. The platform’s drag-and-drop functionality and automated data refresh features reduce the time spent on data preparation, allowing users to focus on data analysis and decision-making.
Data-Driven Decision-Making
The platform empowers organizations to embrace data-driven decision-making. With its customizable dashboards and advanced analytics capabilities, users can track key performance indicators, monitor business metrics, and assess the impact of decisions, enabling them to make informed choices that drive business growth.
Enhanced Data Accessibility
By providing easy-to-use data visualizations and dashboards, Easy Insight enhances data accessibility for all stakeholders within an organization. Users across different departments and roles can access and understand data insights, promoting collaboration and fostering a data-driven culture.
Scalable and Cost-Effective Solution
As a cloud-based platform, the intelligent software solution offers scalability and flexibility for organizations of all sizes. The pay-as-you-go pricing model ensures that businesses only pay for the resources they use, making it a cost-effective solution for data visualization and business intelligence needs.
Real-Time Insights
Easy Insight’s automated data refresh and real-time data visualizations enable organizations to access and analyze the most current information. This real-time Insight allows for proactive decision-making, enabling organizations to respond promptly to changing market conditions and opportunities.
Conclusion
Easy Insight is a powerful business intelligence and data visualization platform empowering organizations to gain deeper insights from their data and make informed decisions. With its user-friendly interface, seamless data integration, and customizable dashboards, the platform transforms raw data into compelling visualizations, enabling organizations to uncover hidden patterns and trends within their data. The intelligent solution drives efficiency, productivity, and growth in today’s data-centric business landscape, from improving data understanding to fostering collaboration and data-driven decision-making. By embracing Easy Insight, organizations can unlock the full potential of their data and gain a competitive edge in the dynamic and fast-paced business world.


