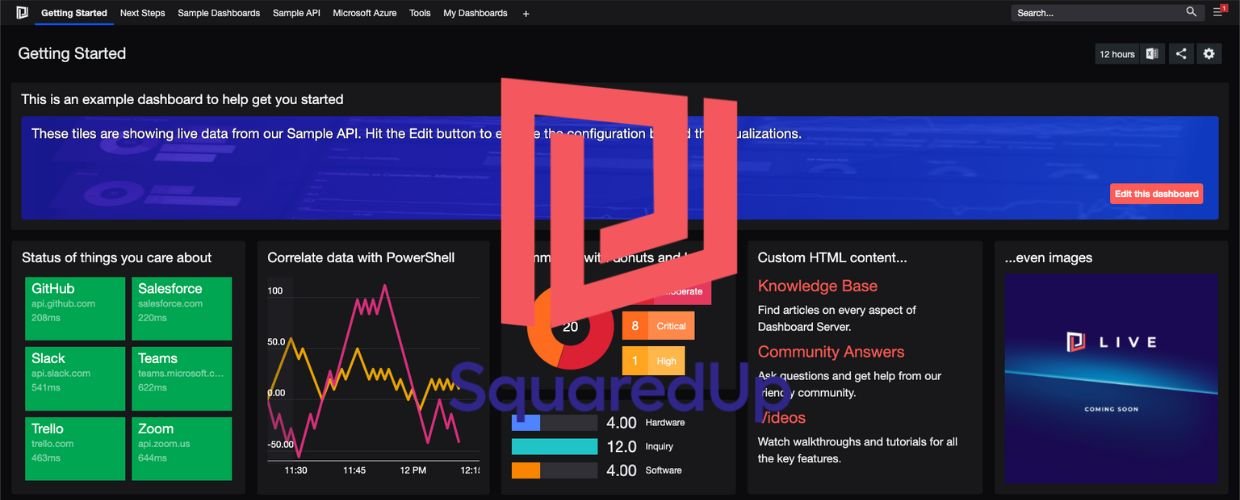
In the ever-evolving world of data-driven decision-making, organizations rely on robust data visualization tools to extract valuable insights from their vast datasets. This article will explore the Community Dashboard Server’s features, benefits, and impact, highlighting how it revolutionizes data visualization and insights for businesses and communities.
What is the Community Dashboard Server (CDS)?
Community Dashboard Server (CDS) is an open-source web-based platform for data visualization and dashboard creation. The platform enables users to connect to various data sources, explore data, and design interactive dashboards without extensive coding or technical expertise. As an open-source solution, CDS provides a collaborative environment where individuals and teams can collaborate, share insights, and create impactful visualizations, making data more accessible and actionable.
The Community Dashboard Server has emerged as a powerful and versatile solution that allows businesses and communities to create, share, and collaborate on interactive dashboards. With its open-source nature, flexibility, and intuitive interface, the platform empowers users to transform complex data into actionable visualizations, fostering a culture of data-driven decision-making.
Recommendations and Ratings
EXPERT RECOMMENDATIONS
Overall
-
Easy-of-Use - 85
-
Feature and Functionality - 85
-
Customer Support - 80
-
Setup and Integration - 85
-
Value of Money - 90
User Review
5 (1 vote)Key Features and Capabilities
Community Dashboard Server offers many features and capabilities that set it apart as a robust and user-friendly data visualization tool. Let’s delve into some key components of this transformative platform.
Data Source Connectivity
One of the standout features of the Community Dashboard Server is its ability to connect to various data sources, including databases, spreadsheets, web services, and APIs. The platform supports different data formats, allowing users to access and visualize data from multiple sources seamlessly.
Interactive Dashboard Creation
It empowers users to create interactive dashboards using a drag-and-drop interface. Users can choose from charts, including bar charts, line charts, pie charts, and heatmaps, to visualize their data effectively. The platform’s intuitive design allows users to customize dashboards, apply filters, and add interactive elements to enhance the user experience.
Real-Time Data Visualization
With Community Dashboard Server, users can visualize real-time data, enabling them to monitor live metrics, track key performance indicators (KPIs), and respond proactively to changing conditions. Real-time data visualization empowers organizations to make informed decisions based on the most up-to-date information.
Role-Based Access and Collaboration
The platform incorporates robust security features, allowing administrators to set user role-based access controls. It ensures that data visualizations and dashboards are accessible only to authorized individuals. Moreover, CDS promotes collaboration by enabling users to share dashboards with colleagues, clients, or stakeholders, facilitating data-driven decision-making.
Embeddable Dashboards
Community Dashboard Server supports embedding dashboards into external websites, applications, or portals. This functionality enables organizations to extend data visualization capabilities to customers, partners, or team members without requiring them to access the platform directly. Embedding dashboards into existing applications enhances user experiences and drives engagement with data insights.
Customizable User Interface
Community Dashboard Server allows users to customize the platform’s interface to match their organization’s branding and identity. It helps make the user experience more personalized and consistent and ensures everyone works with a cohesive and unified look and feel. Using the available customization options, users can create a dashboard that truly represents their organization and helps to strengthen their brand.
Benefits and Impact of the Community Dashboard Server
Adopting the Community Dashboard Server brings numerous transformative benefits for businesses and communities seeking to harness the power of data visualization. Let’s explore some key impacts of using the platform.
Enhanced Data Exploration and Understanding
Community Dashboard Server enables users to explore data visually and interactively, making it easier to identify patterns, trends, and correlations within the data. The intuitive interface allows users to drill down into specific data points, uncovering valuable insights that might have gone unnoticed.
Data-Driven Decision-Making and Actionable Insights
It empowers organizations to make data-driven decisions based on real-time insights. By visualizing data through interactive dashboards, businesses can respond promptly to changing market conditions, optimize processes, and identify growth opportunities, leading to improved business outcomes.
Collaborative Data Culture
Community Dashboard Server is an open-source platform that fosters a collaborative data culture within organizations and communities. Team members can collaborate on data analysis, share insights, and collectively make informed decisions, promoting a data-driven mindset across the organization.
Time and Cost Savings
Community Dashboard Server eliminates the need for manual data extraction and manipulation by automating data visualization and dashboard creation. This automation streamlines the data analysis process, saving time and reducing business operational costs.
Flexibility and Scalability
Its open-source nature allows organizations to customize and extend the platform’s functionality to suit their unique needs. The platform’s scalability also ensures it can handle large datasets and accommodate the growing needs of businesses and communities.
Increased Data Accessibility
It makes data insights more accessible to stakeholders beyond data analysts and technical experts. With its user-friendly interface and interactive dashboards, Community Dashboard Server democratizes data access, allowing decision-makers at all levels to access and interpret data insights easily.
Conclusion
The Community Dashboard Server is a powerful and transformative platform that empowers businesses and communities to harness the power of data visualization. The platform enables organizations to make data-driven decisions confidently with its open-source nature, interactive dashboard creation, and real-time data visualization capabilities. From enhancing data exploration and understanding to promoting a collaborative data culture, the visualization solution drives efficiency, productivity, and growth in today’s data-centric landscape. By embracing Community Dashboard Server, businesses and communities can unlock the full potential of their data, gain a competitive edge, and make informed decisions that propel success and innovation.

