In the age of data-driven decision-making, businesses and organizations rely on sophisticated tools to extract meaningful insights from their vast datasets. In this article, we will explore the features, benefits, and impact of amCharts, highlighting how it empowers users to transform complex data into actionable insights.
What is amCharts?
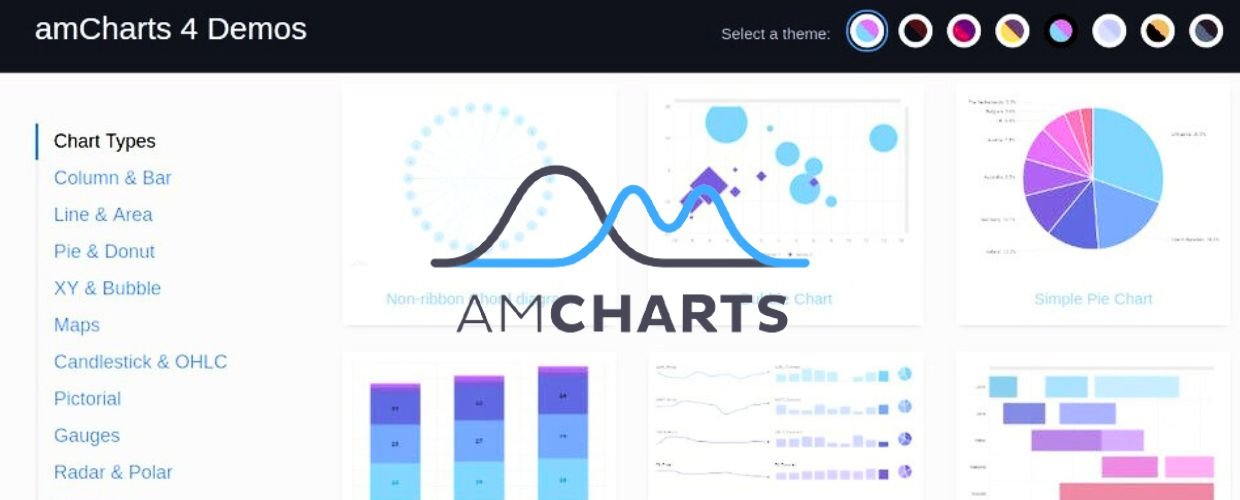
amCharts is a powerful and flexible data visualization library that enables users to create dynamic and interactive charts, graphs, and maps for web and mobile applications. The library provides many chart types, including line charts, bar charts, pie charts, scatter plots, and more. The platform is designed to be easy to use, making it accessible to developers and non-technical users who wish to present data visually appealing and understandable.
amCharts has emerged as a leading data visualization library that empowers users to create visually stunning and interactive charts, graphs, and maps. The visualization software solution revolutionizes how data is presented and understood with its user-friendly interface, extensive customization options, and real-time capabilities. From seamless data integration to responsive mobile-friendly designs, the visualization platform provides a comprehensive solution for developers and non-technical users seeking to communicate data insights effectively.
Recommendations and Ratings
EXPERT RECOMMENDATIONS
Overall
-
Easy-of-Use - 85
-
Feature and Functionality - 85
-
Customer Support - 85
-
Setup and Integration - 85
-
Value of Money - 85

User Review
( vote)Key Features and Capabilities of amCharts
amCharts offers extensive features and capabilities that make it a versatile and popular choice for data visualization. Let’s delve into some key components of this transformative library.
Rich Chart Types and Styles
amCharts provides a rich collection of chart types and styles, allowing users to create various data visualizations to suit their needs. The platform offers diverse visualization options, from classic line charts for time-series data to sophisticated heatmaps for spatial analysis.
Interactive and Real-Time Data Visualization
Its interactive features enable users to drill down into data points, zoom in on specific sections, and toggle data series on and off for a more comprehensive analysis. Additionally, the platform supports real-time data visualization, making it suitable for monitoring dynamic datasets that change frequently.
Customization and Theming
amCharts allows users to customize the appearance of their charts, graphs, and maps to match their branding and user interface. The library offers extensive theming options, enabling users to create visually consistent and appealing data visualizations that align with their application’s design.
Responsive and Mobile-Friendly
The visualization software platform is designed to be responsive and mobile-friendly, ensuring that data visualizations render seamlessly on various devices and screen sizes. This feature is significant in the mobile-first era, where access to data insights on the go is critical.
Dynamic Data Integration
amCharts facilitates dynamic data integration from various sources, including JSON, XML, CSV, and API endpoints. This capability enables users to update their charts and graphs in real-time as new data becomes available, enhancing the accuracy and relevancy of the insights presented.
Exporting and Sharing
The software platform allows users to export charts and graphs in various formats, such as PNG, JPEG, PDF, and SVG. This functionality lets users easily share data visualizations with colleagues, clients, and stakeholders through reports, presentations, or email communications.
Benefits and impact of amCharts
The adoption of amCharts brings numerous transformative benefits for businesses and organizations seeking to communicate complex data effectively. Let’s explore some key impacts of using amCharts.
Enhanced Data Understanding
Its interactive and visually appealing data visualizations enable users to understand complex datasets more intuitively. The ability to explore data through zooming, panning, and drill-down interactions leads to a deeper comprehension of data patterns and relationships.
Data-Driven Decision-Making
amCharts empowers organizations to make data-driven decisions based on clear and actionable insights. The library’s ability to present data in real-time and dynamically update visualizations ensures that decision-makers can access the most up-to-date information for strategic planning and execution.
Improved User Engagement
The visually stunning and interactive nature of amCharts’ visualizations captivates users, increasing their engagement and attention to the presented data. This enhanced user experience encourages stakeholders to explore data insights actively, leading to a deeper appreciation of the information conveyed.
Quick and Easy Data Visualization
amCharts is designed to be user-friendly and efficient, allowing users to create data visualizations quickly and easily. Its straightforward API and intuitive interface simplify integrating charts into web applications, saving time and resources for developers and users alike.
Seamless Integration with Existing Applications
The visualization solution integrates with various programming languages and frameworks, including JavaScript, React, Angular, and Vue.js. This flexibility enables developers to incorporate amCharts’ visualizations into their existing applications without major disruptions.
Enhanced Communication and Reporting
Its visually appealing and interactive data visualizations enhance organizational communication and reporting efforts. Whether presenting data to internal teams, stakeholders, or clients, amCharts’ ability to convey complex information clearly and compellingly bolsters the effectiveness of data-driven communication.
Conclusion
amCharts is a powerful and versatile data visualization library that empowers businesses and organizations to present data visually stunningly and interactively. With its rich chart types, customization options, and real-time capabilities, the platform unlocks the full potential of data, leading to enhanced data understanding, data-driven decision-making, and improved user engagement. By embracing amCharts, organizations can elevate their data visualization efforts, drive informed decision-making, and stay ahead in the dynamic and data-centric business landscape.