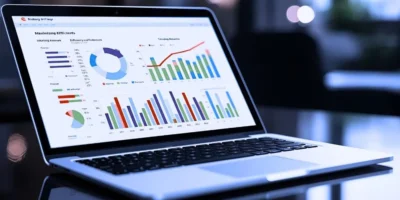
In the era of data-driven decision-making, organizations rely on advanced tools and technologies to transform raw data into meaningful insights. Looker, a leading data visualization platform, empowers users to explore and analyze data through intuitive and interactive visualizations. With its powerful capabilities, Looker enables organizations to unlock the value of their data, uncover patterns, and make informed decisions. This article explores Looker visualization, its features, benefits, and its transformative impact on data analysis and reporting.
Understanding Looker Visualization
Looker is a data visualization and business intelligence platform that allows users to create interactive visualizations and reports from various data sources. Looker’s visualization capabilities enable users to explore data, identify trends, and communicate insights effectively. With a user-friendly interface and powerful data modeling capabilities, Looker allows users to transform complex datasets into clear, actionable visualizations, empowering organizations to make data-driven decisions.
Features and Benefits of Looker Visualization
The Looker Visualization tool provides a wide range of features and benefits, making it a must-have for businesses looking to streamline their data analysis process.
Drag-and-Drop Interface
Looker offers a drag-and-drop interface that simplifies the process of creating visualizations. Users can select and arrange data fields, apply filters, and choose from various visualization types, such as charts, graphs, and maps. The intuitive interface lets users quickly create customized visualizations without complex coding or technical expertise.
Interactive and Dynamic Visualizations
Looker visualizations are interactive and dynamic, allowing users to explore data from different angles and levels of detail. Users can drill down into specific data points, apply filters, and interact with the visualizations in real time. This interactivity enables users to gain deeper insights and uncover hidden patterns or trends within the data.
Real-Time Data Updates
Looker integrates with various data sources, enabling users to access and visualize real-time data. Real-time data updates ensure users have the most up-to-date information, facilitating timely decision-making. With Looker’s ability to connect to live data streams, organizations can monitor key metrics and respond quickly to changing conditions.
Advanced-Data Modeling and Calculation
Looker’s data modeling capabilities allow users to transform raw data into meaningful metrics and calculations. Users can create custom measures, define calculations using Looker’s modeling language, and apply advanced analytics techniques to derive insights. Looker’s data modeling features ensure accuracy and consistency in data analysis and reporting.
Collaboration and Sharing
Looker facilitates collaboration and sharing of visualizations and insights within an organization. Users can create dashboards and reports that can be shared with colleagues, enabling collaborative decision-making. Looker’s sharing options allow users to publish visualizations, embed them in other applications or websites, and schedule automated reports for distribution.
Mobile-Friendly Design
Looker visualizations are designed to be mobile-friendly, allowing users to access and interact with data on various devices, including smartphones and tablets. The responsive design ensures visualizations are optimized for different screen sizes, delivering a consistent user experience across devices.
Impact of Looker Visualization
The impact of Looker Visualization on businesses must be considered. By enabling users to quickly and easily analyze data, Looker has helped countless organizations identify new opportunities, streamline operations, and improve overall business performance.
Enhanced Data Exploration and Analysis
Looker visualization empowers users to explore data and gain deeper insights. The interactive and dynamic nature of Looker visualizations allows users to drill down into specific data points, apply filters, and perform ad hoc analysis. This capability enables users to uncover trends, correlations, and anomalies within the data, facilitating data-driven decision-making.
Improved Data Communication
Looker visualizations enable users to communicate complex information effectively. By presenting data in clear and visually appealing formats, Looker facilitates stakeholder understanding and engagement. Visualizations can be customized to align with specific business needs and shared across teams, departments, and organizations to drive alignment and informed decision-making.
Increased Efficiency and Productivity
Looker’s intuitive interface and drag-and-drop functionality streamline the process of creating visualizations. It saves time and reduces the dependency on IT or data specialists for data analysis and reporting. Users can quickly generate and modify visualizations, enabling them to focus on analyzing insights and taking action, ultimately increasing productivity across the organization.
Democratization of Data
Looker’s user-friendly interface and self-service capabilities democratize data access and analysis within organizations. Users across different roles and departments can leverage Looker to explore data, gain insights, and make data-driven decisions independently. It empowers teams to be more agile and responsive to changing business needs.
Scalability and Customizability
Looker is highly scalable and can handle large and complex datasets. Looker can adapt and accommodate expanding data volumes and user requirements as organizations grow and generate more data. Looker’s flexible modeling and customization options allow organizations to tailor visualizations and reporting to their needs, ensuring relevance and accuracy.
Conclusion
Looker visualization is a powerful tool that empowers organizations to extract insights from their data, communicate information effectively, and make informed decisions. With its user-friendly interface, interactive capabilities, real-time data updates, and collaboration features, Looker enables users to explore, analyze, and share data-driven insights.
Looker visualization enhances data exploration, improves communication, increases efficiency and productivity, democratizes data access, and enables scalability and customization. By harnessing the power of Looker visualization, organizations can unlock the full possibility of their data and drive success in today’s data-driven business landscape.


