The Internet of Things (IoT) has revolutionized our interaction with technology and the world. With billions of connected devices generating vast amounts of data, harnessing and making sense of this data is crucial. It is where IoT data visualization comes into play. In this article, we will explore the concept of IoT data visualization, its importance, key techniques, and its impact on various industries.
Understanding IoT Data Visualization
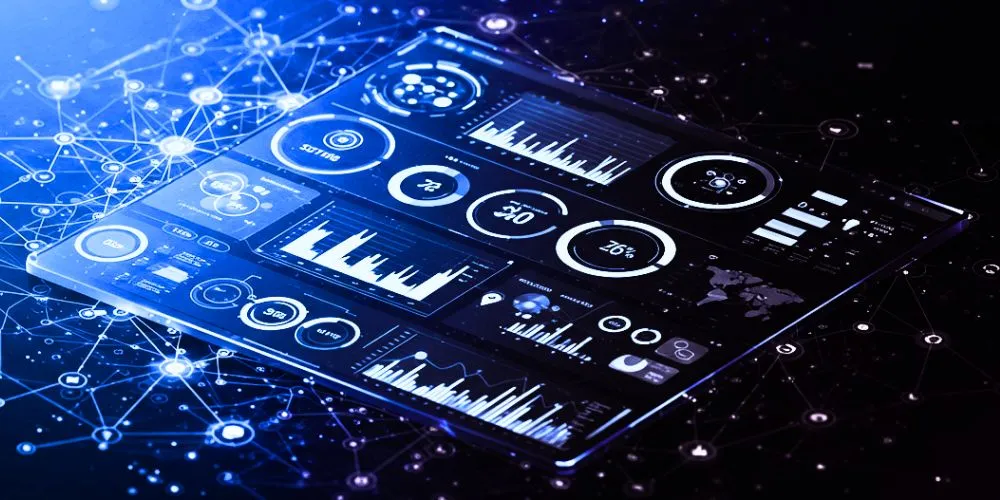
IoT data visualization is an important aspect of managing interconnected devices. It allows us to represent complex data sets clearly and effectively, using visually appealing charts, graphs, and dashboards. By intuitively presenting data, IoT data visualization enables users to quickly identify patterns and gain valuable insights that inform their decision-making process. With the help of this powerful tool, businesses can effectively manage their IoT devices and leverage the data they generate to optimize their operations and improve performance. Whether you are a data analyst, business owner, or simply interested in the latest technology trends, understanding IoT data visualization is an essential skill that can help you stay ahead of the curve.
Importance of IoT Data Visualization
The amount of data generated by these connected devices is growing exponentially as the world becomes increasingly connected through the Internet of Things (IoT). While this data can be valuable, it can also be overwhelming to manage and interpret without proper data visualization tools.
Simplifying Complexity
IoT generates massive amounts of data from diverse sources and formats. Data visualization simplifies this complexity by presenting data in a visual format that is easy to interpret, enabling users to gain insights quickly. Instead of poring over spreadsheets or raw data, users can leverage visualizations to gain a clear understanding of the information at a glance.
Real-time Monitoring and Control
IoT data visualization allows users to monitor real-time data from connected devices. It visualizes key performance indicators, alerts, and anomalies, empowering users to take immediate action and make timely decisions. For example, in a manufacturing environment, real-time monitoring through visualizations can help identify production bottlenecks, equipment failures, or quality issues, allowing for proactive intervention.
Pattern Recognition
Visualizing IoT data makes patterns and trends more apparent. Users can identify correlations, anomalies, and emerging practices that may not be immediately evident in raw data, enabling them to respond proactively. For instance, visualizing data from sensors embedded in machinery in predictive maintenance can help detect early signs of equipment failure, enabling timely repairs and reducing downtime.
Data-driven Decision Making
Data visualization enhances data-driven decision-making. By presenting data in a visually compelling manner, decision-makers can easily understand and analyze complex information, leading to more informed and effective decisions. Whether optimizing energy usage in a building or analyzing customer behavior in a retail setting, visualizations provide a clear picture of the data, enabling organizations to make strategic choices based on insights.
Key Techniques for IoT Data Visualization
When visualizing IoT data, several key techniques can help make sense of the vast amounts of information generated by connected devices.
Dashboards
Dashboards provide a consolidated view of critical IoT data on a single screen, offering a comprehensive overview of key information. They typically include charts, graphs, and key performance indicators (KPIs), enabling users to monitor real-time data and track metrics relevant to their specific needs. Dashboards can be customized to display data from various IoT devices and present it in a visually appealing manner.
Geographic Mapping
IoT data visualization can leverage geographic maps to display data collected from connected devices across different locations. This technique is beneficial for asset tracking, environmental monitoring, and smart city management applications. By overlaying sensor data on maps, users can gain valuable insights into spatial patterns, identify areas of high activity, and optimize resource allocation.
Time-series Analysis
Time-series analysis visualizes data over time, enabling users to identify trends, patterns, and anomalies. Line charts, area charts, and heatmaps are commonly used for visualizing time-series data collected from IoT devices. Time-series visualizations can reveal seasonality, periodic patterns, or changes over time, aiding in predictive analysis and forecasting.
Streamgraphs and Sankey Diagrams
Streamgraphs and Sankey diagrams effectively showcase the flow and distribution of data. They are commonly used for visualizing energy consumption, network traffic, and resource allocation within IoT systems. These visualizations help identify inefficiencies, bottlenecks, and areas for optimization, enabling organizations to make data-driven decisions and improve operational efficiency.
Impact of IoT Data Visualization
The impact of effective IoT data visualization must be balanced. Businesses and individuals can gain valuable insights and identify trends that would otherwise go unnoticed by utilizing interactive dashboards, data visualization tools, and machine learning algorithms.
Industrial Applications
In industrial settings, IoT data visualization enables real-time monitoring of equipment performance, energy usage, and production metrics. It enhances operational efficiency, facilitates predictive maintenance, and optimizes resource allocation. For example, visualizing data from sensors embedded in manufacturing equipment can help identify patterns of inefficiency, reduce downtime, and optimize production processes.
Smart Cities
IoT data visualization is vital in managing and optimizing city infrastructure. Visualizing data from sensors embedded in various urban systems allows city authorities to monitor traffic patterns, air quality, waste management, and energy consumption. With visual insights, city planners can make informed decisions to enhance sustainability, improve citizen services, and create more livable environments.
Healthcare
IoT data visualization enables remote patient monitoring, facilitates real-time health data analysis, and supports personalized healthcare. It enables healthcare providers to make informed decisions, improve patient outcomes, and proactively respond to critical situations. Visualizing patient data from wearable devices or medical sensors can help detect early signs of health deterioration, monitor chronic conditions, and optimize treatment plans.
Environmental Monitoring
IoT data visualization facilitates the tracking of ecological parameters, including air quality, temperature, and water quality. It enables policymakers, environmentalists, and researchers to identify pollution hotspots, assess the impact of interventions, and drive sustainable practices. By visualizing real-time environmental data, stakeholders can take timely actions to mitigate risks and preserve natural resources.
Retail and Supply Chain Management
IoT data visualization enhances inventory management, demand forecasting, and supply chain optimization. Visualizing data from RFID tags, sensors, and connected devices enables retailers to track product movement, analyze consumer behavior, and streamline logistics. By understanding customer preferences, retailers can personalize marketing campaigns, optimize inventory levels, and improve customer satisfaction.
Conclusion
IoT data visualization is a powerful tool that unlocks insights from the vast amount of data generated by connected devices. By presenting data in a visually appealing and intuitive manner, it simplifies complexity, enables real-time monitoring, and empowers decision-makers to make data-driven choices. From industrial applications to smart cities, healthcare, and retail, IoT data visualization has a transformative impact on various industries.
As the IoT continues to grow, harnessing the power of data visualization will be critical for organizations to derive meaningful insights and unlock the full potential of the connected world. By embracing IoT data visualization, businesses and communities can drive innovation, improve efficiency, and make informed decisions in the age of connected devices.