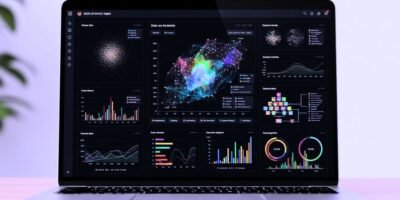
In today’s data-driven world, the sheer volume and complexity of information can be overwhelming. Businesses and individuals seek ways to make sense of this data and extract valuable insights. This is where information visualization comes into play. Information visualization is a powerful tool that allows us to represent data visually, enabling us to explore, analyze, and communicate information more effectively. This article will explore the concept of information visualization, its importance, techniques, and impact across various domains.
The Growth of Information Visualization
Over the past decade, information visualization has experienced significant growth and development. With the advent of big data and technological advancements, the need to make sense of vast amounts of information has become more pressing than ever. As a result, information visualization techniques and tools have evolved to meet the demands of various industries and domains.
Data Visualization Tools and Software
The availability of sophisticated data visualization tools and software has played a crucial role in the widespread adoption of information visualization. These tools provide a user-friendly interface and a wide range of visualization options, allowing users to create interactive and dynamic visualizations without requiring advanced programming skills.
Some popular data visualization tools include Tableau, Power BI, D3.js, and Python libraries such as Matplotlib and Seaborn. These tools offer a variety of visualization types, customization options, and data integration capabilities, enabling users to create compelling visualizations that effectively convey insights.
Integrating Visualization and Data Analytics
Visual analytics is an interdisciplinary field that combines information visualization with data analytics techniques. It aims to enable users to gain deeper insights from data by integrating advanced analytical methods with interactive visualizations.
Visual analytics tools leverage clustering, classification, and regression techniques to extract patterns, detect anomalies, and provide real-time analysis. By coupling these analytical capabilities with interactive visualizations, users can explore and interact with complex datasets, uncover hidden patterns, and make data-driven decisions.
Emerging Trends and Technologies
As information visualization continues to evolve, several emerging trends and technologies are shaping the field:
Augmented and Virtual Reality
Augmented and Virtual Reality (AR/VR) technologies are increasingly used in information visualization to provide immersive and interactive experiences. They enable users to visualize data in three-dimensional spaces, allowing for deeper exploration and a more comprehensive understanding of complex datasets.
Machine Learning and Artificial Intelligence
Machine learning and Artificial Intelligence (AI) techniques are being integrated into information visualization to automate data analysis and visualization. These technologies can automatically identify patterns, recommend suitable visualization types, and facilitate data exploration.
Natural Language Processing
Natural Language Processing (NLP) techniques extract meaning and insights from unstructured text data. Combining NLP with information visualization enables the transformation of textual information into visual representations, making it easier to analyze and comprehend large volumes of text data.
Data Storytelling
Data storytelling is an approach that combines narrative techniques with visualizations to effectively communicate insights and engage audiences. By structuring data visualizations within a storytelling framework, information visualization becomes a powerful tool for conveying complex concepts and making data more relatable and memorable.
Challenges in Information Visualization
While information visualization offers numerous benefits, it also presents challenges that need to be addressed:
Data Quality and Preprocessing
Poor data quality, missing values, and inconsistencies can hinder effective visualization. Data preprocessing steps such as cleaning, filtering, and transforming are essential to ensure accurate and meaningful visual representations.
Visual Clutter and Overload
Displaying too much information or using complex graphic designs can lead to visual clutter and overwhelm the viewer. Careful design choices, including the appropriate use of data aggregation, color, and visual cues, as well as interactive features, can help reduce clutter and enhance comprehension.
User Perception and Bias
Users may interpret visualizations differently based on prior knowledge, cultural background, and cognitive biases. It is essential to consider the target audience and design visualizations that cater to different levels of expertise, thereby mitigating potential biases.
Scalability and Performance
Visualizing large and high-dimensional datasets can be challenging due to scalability and performance issues. Techniques such as data aggregation, sampling, and hierarchical visual representations address these challenges, enabling the efficient visualization of complex datasets.
Future Directions
The future of information visualization holds great promise as technology continues to advance and new domains discover the value of visualizing data. Some potential future directions include:
Explainable AI
As AI techniques become more prevalent in data analysis and decision-making, explaining the rationale behind AI-driven insights becomes crucial. Information visualization can be vital in providing transparent and interpretable representations of AI models and their outputs.
Immersive Visualization
Augmented reality (AR) and virtual reality (VR) technologies are expected to play a more significant role in information visualization, offering immersive and interactive experiences. It could enable users to explore data in virtual environments and manipulate visual representations using natural gestures.
Real-Time and Streaming Data Visualization
With the increasing availability of real-time and streaming data, visualization techniques must adapt to handle dynamic and continuously changing datasets. Real-time visualizations that update in real-time, along with streaming-specific visualization techniques, will become more prevalent.
Ethical and Responsible Visualization
As data becomes more accessible and powerful, ethical considerations in information visualization become paramount. Designing inclusive visualizations, avoiding misleading interpretations, and protecting privacy will be essential to ensuring responsible data use.
Conclusion
Information visualization has proven invaluable for understanding complex data, facilitating decision-making, and enhancing communication in today’s data-driven world. By harnessing the power of visual representation, information visualization enables us to unlock insights, make connections, and communicate information effectively. As technology advances and new challenges emerge, the field of information visualization will continue to evolve, empowering individuals and organizations to unleash the power of visual representations.


