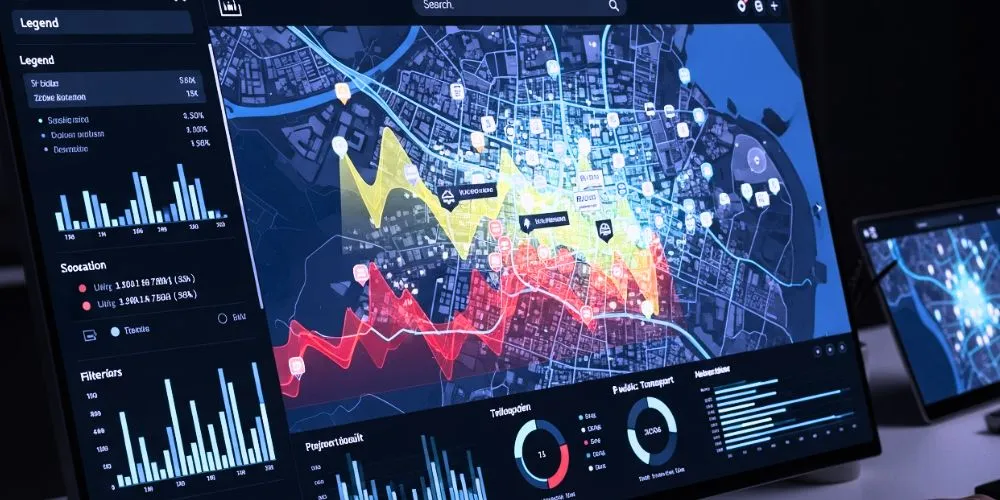
Map visualization is a captivating and potent technique that leverages the prowess of geospatial data to weave intricate narratives of information. In our world, where connections span continents, and data proliferates at unprecedented rates, maps have transcended mere navigation tools to emerge as indispensable instruments for comprehending and conveying complex data within a spatial context. From dissecting business dynamics to scrutinizing environmental shifts and orchestrating urban symphonies, map visualization unfurls a tapestry of patterns, trends, and relationships that often remain veiled in conventional data presentations. This discourse delves into the profound significance of map visualization, its key components, and the transformative impact it bestows upon the understanding and utilizing geospatial data.
The Significance of Map Visualization
Map visualization serves as a bridge between data and understanding, as it provides context and spatial relationships to information. The following points underscore the significance of map visualization.
Spatial Insights
At the heart of map visualization lies its unique capability to infuse data with the essence of space. This attribute empowers stakeholders to fathom the intricate spatial distribution of information, thereby kindling insights that might have eluded traditional data representations. As a result, decision-makers are endowed with a panoramic perspective, enabling them to make informed choices that are attuned to the geographical nuances of the data.
Effective Communication
As visual artifacts, Maps can transcend language and technical barriers. Their intuitive nature renders them a formidable communication medium capable of articulating intricate data concepts to diverse audiences. Presenting data in a familiar and visually appealing manner facilitates seamless communication and bridges the gap between technical experts and laypersons.
Identifying Patterns and Trends
The spatial context offered by map visualization unveils patterns, clusters, and trends that often lie dormant within data sets. Distilling complex datasets into a visual terrain is a revealing lens, unraveling relationships and connections that might have otherwise gone unnoticed. Its heightened perception is invaluable for strategic decision-making and future planning.
Geospatial Analysis
The power of geospatial analysis lies at the core of map visualization. This technique enables organizations to dissect and interpret data through a geographical lens. By overlaying data layers onto maps, businesses can discern geographic impacts, assess potential correlations, and formulate strategies tailored to specific regions.
Enhanced Problem-Solving
Maps serve as compasses in the realm of problem-solving. Whether it’s optimizing supply chain routes, devising healthcare outreach programs, or responding to disasters, the spatial insights offered by map visualization foster a comprehensive understanding of the challenges at hand. Armed with this clarity, stakeholders can chart more effective paths toward resolution.
Critical Components of Map Visualization
When it comes to map visualization, several critical components must be taken into consideration. First and foremost, the accuracy and quality of the data being used is of utmost importance.
- Geospatial Data Collection: The journey of map visualization commences with the meticulous collection of geospatial data. This data, sourced from satellites, GPS devices, remote sensing technologies, and on-ground surveys, forms the bedrock upon which the map narrative is constructed.
- Geographic Information System (GIS): At the heart of map visualization lies the Geographic Information System (GIS), a technological marvel that processes, analyzes, and manipulates geospatial data. GIS breathes life into maps by integrating various data sources and geographical attributes, creating interactive and dynamic visualizations.
- Data Visualization Tools: The canvas upon which the art of map visualization is painted comprises specialized data visualization tools. GIS software and mapping platforms such as ArcGIS, QGIS, and Tableau facilitate the creation of intricate maps replete with layers of information, each contributing to a more prosperous, multi-dimensional story.
- Customization and Interactivity: A hallmark of modern map visualization is its ability to be tailored to specific needs and to engage users through interactivity. Audiences can zoom in, pan out, toggle layers, and explore data points, thereby embarking on a personalized journey of discovery within the map.
- Data Integration: They often thrive on the synergy of diverse datasets. Demographic data, environmental variables, economic indicators, and even real-time inputs seamlessly merge within the spatial realm, presenting a holistic panorama of information that lends depth and context to the narrative.
Transformative Impact of Map Visualization
Map visualization has the potential to have a transformative impact on the way we understand and communicate complex information. With accurate data, straightforward design, and interactive features, maps can provide a visual representation of data that is both informative and engaging.
- Location-Based Decision-Making: The marriage of map visualization and data enables businesses and governments to make location-based decisions. By dissecting data through a geographic lens, organizations can optimize resource allocation, devise localized strategies, and sculpt precise action plans.
- Emergency Response and Disaster Management: In moments of crisis, map visualization morphs into a lifeline. This tool transforms chaos into coordinated action by swiftly assessing affected areas, coordinating relief efforts, and allocating resources based on real-time geospatial insights.
- Environmental Monitoring and Conservation: It emerges as a sentinel in ecological stewardship. It tracks alterations in landscapes, monitors the ebb and flow of wildlife populations, and bolsters conservation endeavors through a dynamic portrayal of the Earth’s evolving state.
- Business Intelligence and Market Analysis: For businesses, map visualization is an oracle that deciphers market trends and consumer behaviors. It dissects demographic data, delves into consumer distribution, and reveals pockets of opportunity, providing a blueprint for strategic expansion.
- Urban Planning and Infrastructure Development: In burgeoning urban landscapes, it assumes the role of an architect. It designs resilient and sustainable infrastructures, analyzes population growth, optimizes transportation networks, and orchestrates the harmonious evolution of cities.
Conclusion
The symphony of map visualization orchestrates a transformative cadence that resonates across industries and domains. It transmutes cold data into vibrant narratives, infuses geographic context into strategic deliberations, and empowers decision-makers with unprecedented clarity. It is more than an art; it is a potent instrument for change.
As technology accelerates, the influence of map visualization burgeons, promising a future where geospatial data becomes an unparalleled asset, steering us toward more intelligent, more informed decisions. This age of interconnectedness and data abundance beckons us to embrace map visualization as a guiding star, navigating us through the complex labyrinth and illuminating a path to a more illuminated, data-driven world.


